Many hundreds of you have been flooding our inbox asking if Coinbase paid us to write this article: Expressing A View. No they did not. We’d happily accept their support though. If you are holding $COIN, please let them know they can send funds to footguns.eth .
Will ETH Flip BTC?
Today, we are going to use the data available through Glassnode to address whether or not ETH’s maketcap will flip BTC’s. There are many talking heads and Twitter personalities loudly shouting that ETH will flip BTC. Are they right? Could this happen? Lets see if onchain data can give us any insight.
Adoption Rate
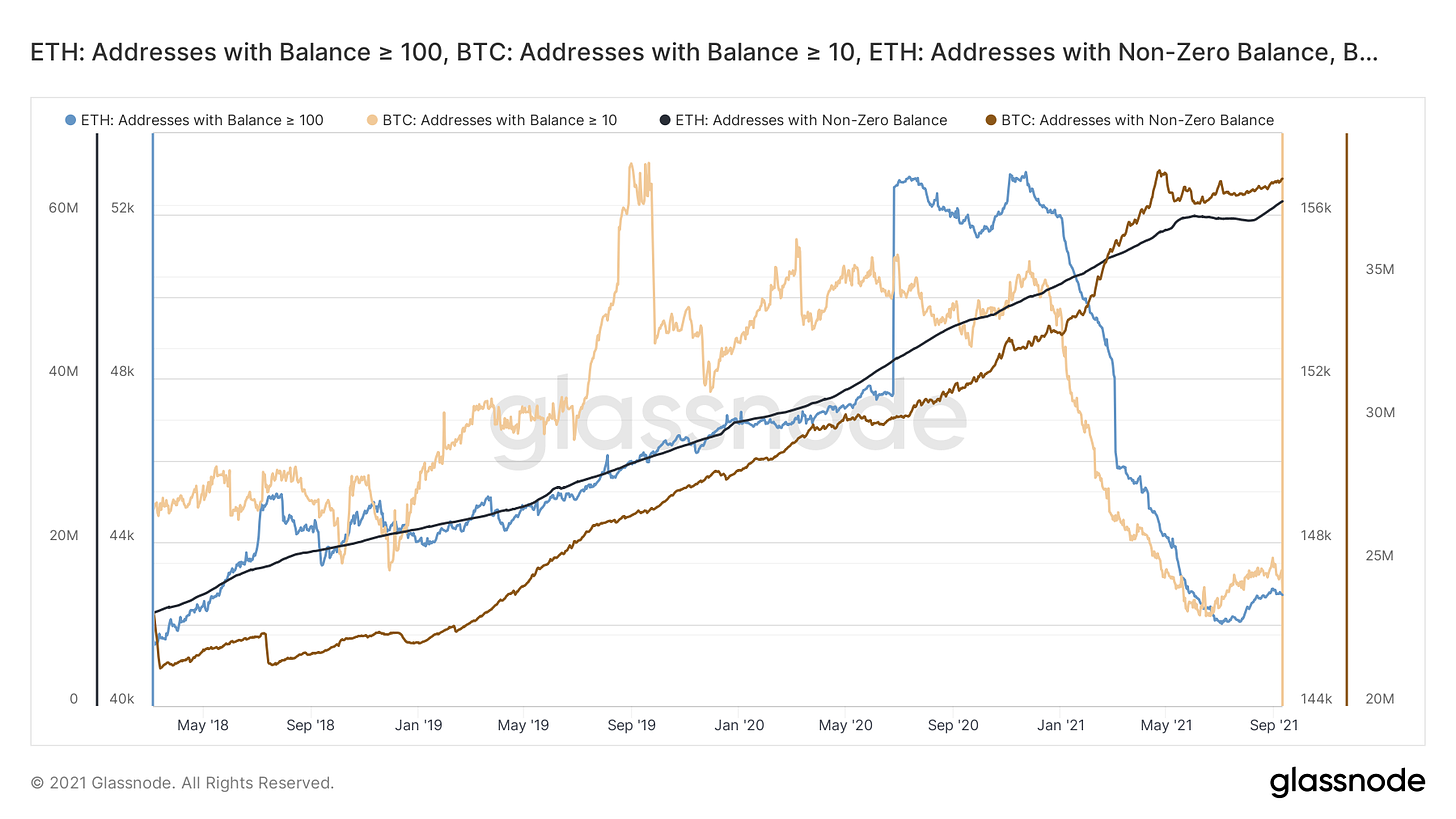
The first chart we will look at shows the total number of addresses that hold any amount of ETH(in black) vs any amount of BTC(in brown). You can see that the total number of ETH addresses with a non-zero balance is around 60M, while the total number of BTC addresses is only around 40M. By this metric, ETH has already flipped BTC. In May 2018 there were 22M BTC addresses with non-zero balances and only 10M ETH addresses.
On the same chart, we’ve shown in blue the total number of ETH addresses with 100 or more ETH and compared that with the total number of addresses with 10 or more BTC. At current prices that’s about $450,000 in BTC and $330,000 in ETH. You can see that ETH is no where close to BTC on this metric. The total number of ETH addresses holding this amount is about 1/3 the number of BTC addresses holding this amount.
Revenue
Next up is the total revenue generated by BTC miners compared to ETH miners. This chart can be a little tricky to interpret because the scales are not in USD but instead ETH and BTC. The scale of the left matching the blue line shows the ETH generated for ETH miners and on the right side the orange line shows the BTC generated for BTC miners. The dollar value of ETH has risen greatly since 2016 and the total amount of ETH being paid to miners was declining until January 2020. Since then the total amount of ETH being paid to miners has returned to 2016-2017 levels even making a new high in the summer of 2020.
Over the same time period the number of Bitcoin being paid to miners was intentionally reduced. In July 2016 and July 2020, Bitcoin’s pre-programmed halvening events cut the rewards paid to miners for successfully mining a block in half. This means the total amount of BTC paid to miners in January 2016 was about 4000 BTC worth $1.6M USD at the time. Now, in September 2021, miners only receive 1000 BTC but with the price rise that is now worth $45M USD. The halvening events appear to have worked well for BTC miners. The total amount of new supply onto the market has been reduced and miners are making 20x the revenue from four and a half years ago.
However, the amount of ETH being paid to ETH miners has not decreased and is much more volatile. In January 2016 nearly 25,000 ETH was paid to miners worth $12,000 USD at the time. Currently, the same amount of ETH is going to miners but is now worth $100M USD at current prices. This means ETH miners are earning nearly 2x the total amount of USD equivalent value as BTC miners. Another way ETH has flipped BTC. This does however represent a higher amount of inflation to the ETH supply because in order to actualize this dollar value the miners have to sell their ETH on the market.
Inflation Rate
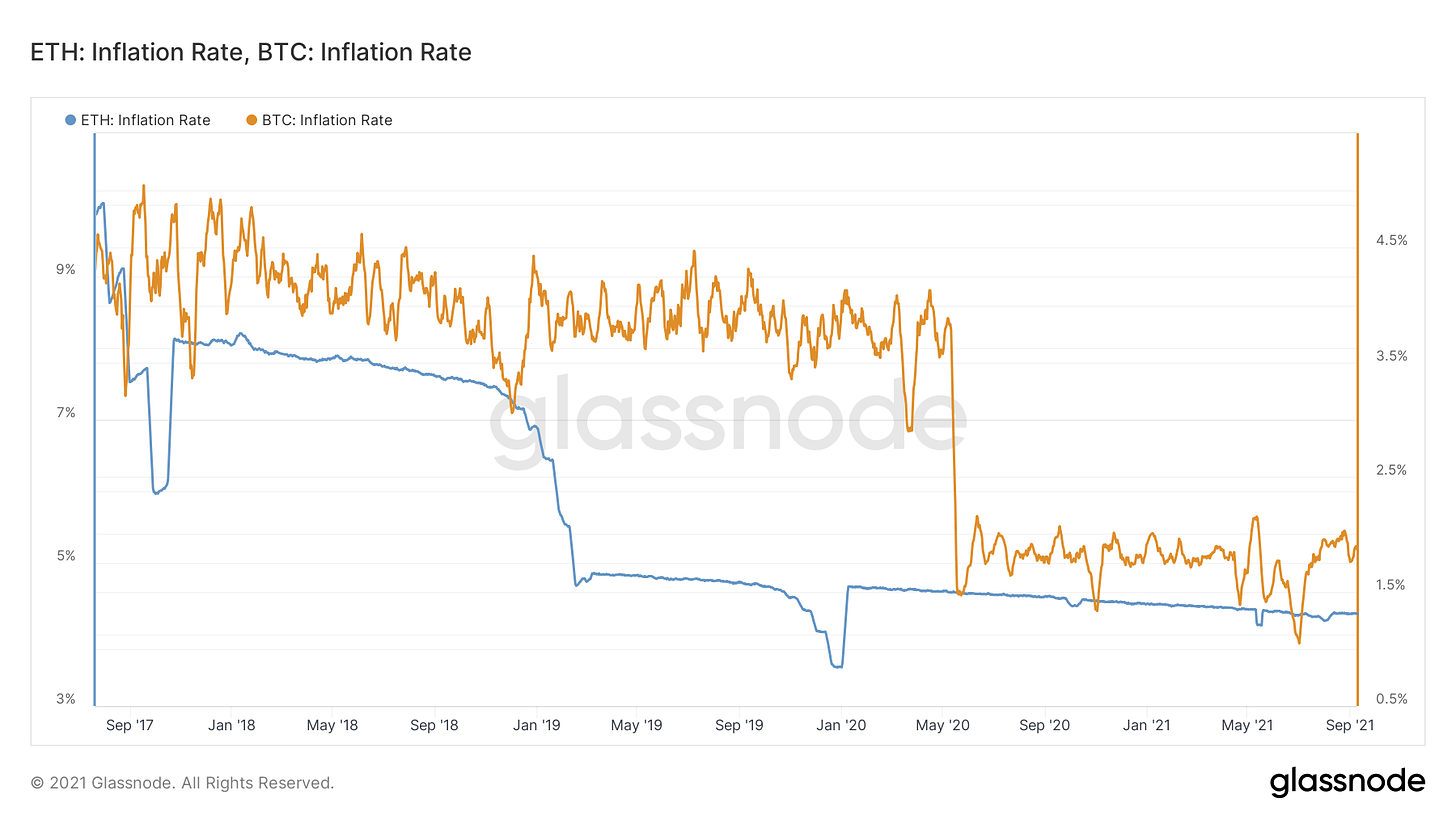
Probably not coincidentally, ETH’s inflation rate (ETH miners making twice as much return in $USD than BTC miners) is about twice the inflation rate of BTC. You can see how BTC inflation was cut in half in May 2020 due to the preprogrammed halvening event. ETH inflation schedule is not preprogrammed and instead can be altered by the Ethereum Foundation. EIP-1559 is expected to have an impact on ETH’s inflation rate as a percentage of ETH is now being burned during transactions and not being sent to miners as a reward. With EIP-1559 now in effect, will ETH miners continue to receive nearly twice the amount of fees that Bitcoin miners do? Only time will tell.
Entities In Profit
This is a favorite statistic among the Bitcoin onchainists. Net Unrealized Profit/Loss (NUPL) is derived by comparing the price of BTC or ETH when an addressed received BTC or ETH compared to the current price. Effectively, what is the net difference between addresses in profits and addresses holding a lose. This is incredibly uninteresting when comparing ETH and BTC. It does show that over ETH’s short history there has been relatively little difference in BTC’s and ETH’s NUPL values. You can see periods of time where Bitcoiners were doing better than Etherians and vice versa.
Exchange Balance
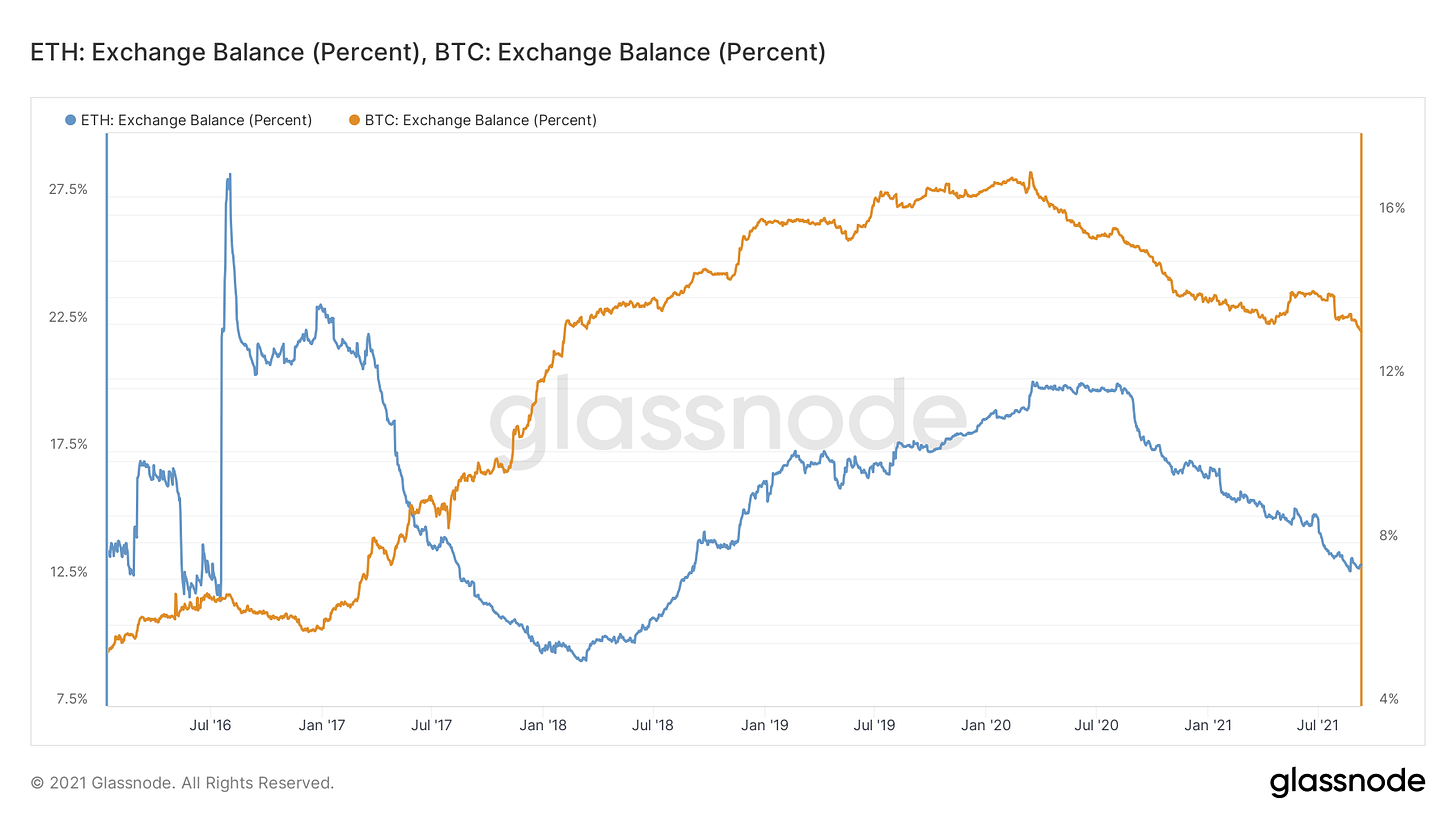
Interestingly, since January 2018 this statistic has been perfectly correlated. This is the total % of BTC and ETH supply that is held on exchanges. On chain analysts love this statistic because the theory is that coins moving to exchanges want to sell and coins moving off exchanges plan to hold for a longer period. There is currently 13% of the total supply being held on exchanges for both BTC and ETH. This number also appears to be declining at a similar rate. Both peaked in in mid 2020 around the time of the emergence of DeFi.
It is our controversial opinion that supply on exchanges has no relevance to the price other than on shorter time frames. We think what we are witnessing is supply moving off centralized exchanges into decentralized exchanges. The evidence for this is BTC’s price rose and fell in 2019 and there is no significant exchange supply increase or decrease around that event. BTC’s and ETH’s price peaks in 2017 and 2018 also show opposite behaviors for exchange balances.
Who Is Holding The Bag
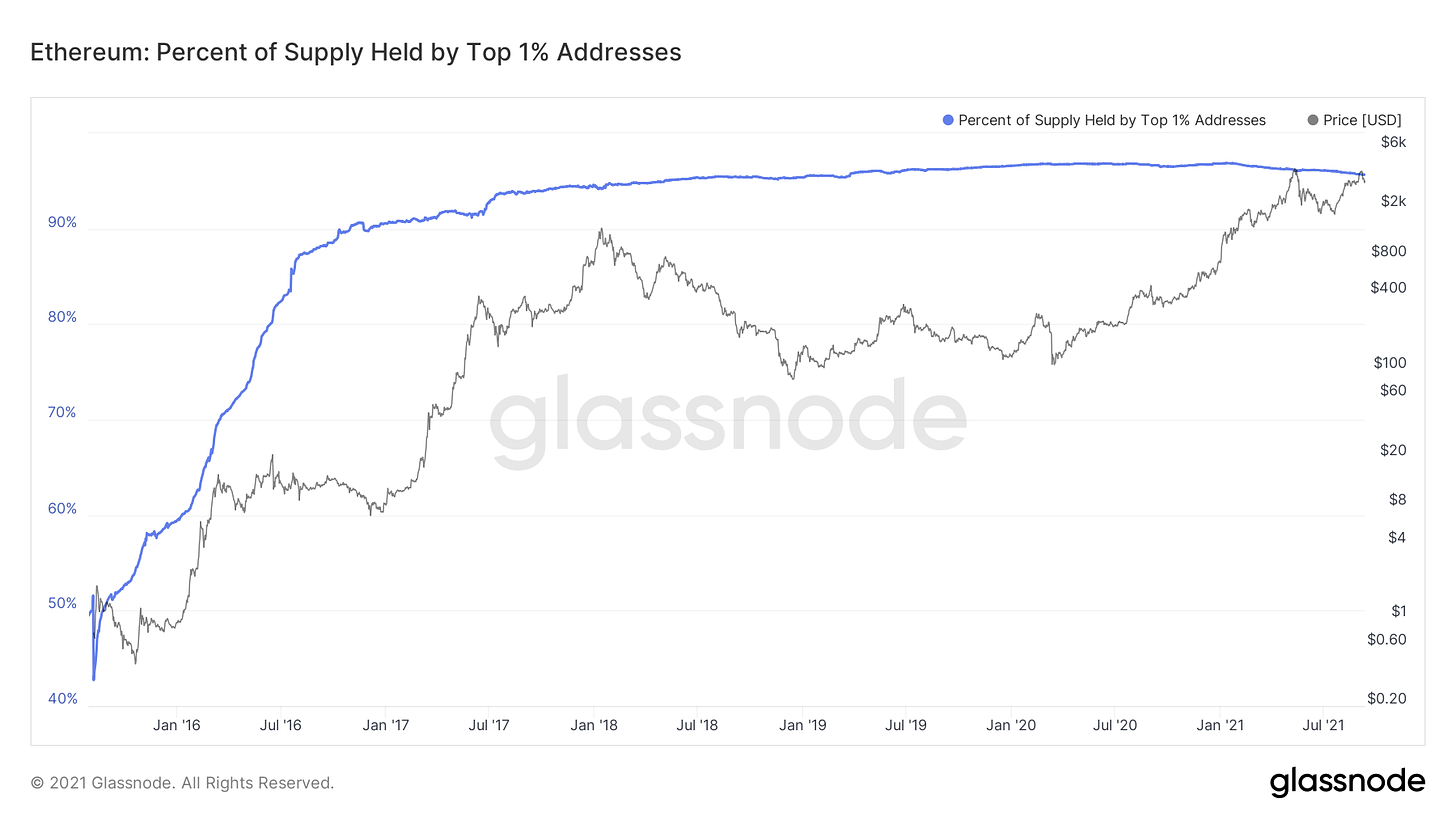
This is the one onchain metric we can’t wrap our heads around. This is showing the total percentage of ETH held by the top 1% of addresses. Glassnode’s description of this statistics says,
Exchange addresses, smart contract addresses, and other special asset-specific addresses (e.g. team fund addresses) are excluded.
There also is no equivalent statistic available for BTC on Glassnode. However, in the first chart we showed you there are far more BTC addresses holding >$450k USD in value than ETH holding >$330k USD in value. You could conclude from this that there are only a handful of addresses in the world holding nearly all of the ETH supply. That is a major Foot Gun to us and something to keep and eye on.
Don’t miss your chance to participate in the FGNEWS token airdrop. Read more here. Offer ends Sept 30th.
NFTs have been going wild and it’s a lot to keep up with. If you’d like to follow along more closely with the NFT ecosystem we recommend you check out Morning Drop, “Your weekly dose of what’s minting, popping, and brewing”.


Is "inflation" really the right term given how little these currencies at used to purchase real world goods? Stock prices go up but no one cares about the "inflation" of AAPL.
not sure what conclusion to make, but interesting analysis to know where these two are different. thankyou for sharing