


Back Again
Bitcoin held support again. Do you think the price can get back above $40k this time? Are you buying?

CHEAT SHEET
Support and resistance levels and our daily, weekly and monthly bias on BTC, ETH, OIL, ES, and NQ as well as our favorite altcoins.

Crypto News
Dubai Real Estate Developer to Accept Crypto Payments Amid UAE Push for Crypto Hub Status (CoinDesk)
US, EU Members Among 60 Nations Calling for Open, Global Internet (CoinDesk)
Propy partners with Abra to provide crypto-backed real estate loans (CoinTelegraph)
One-fifth of businesses in El Salvador now accept Bitcoin (CoinTelegraph)
FTX Announces $1 Billion Charity Fund and First Print Ad Campaign (Decrypt)
Ripple's Fight Against the SEC: How the Case Is Going and How it Might End (Decrypt)
‘Lawless’ Crypto Industry Needs Harsh Regulation, European Central Bank Exec Says (Blockworks)
Ex-Jefferies Execs, Former Euronext FX CTO To Launch Crypto Exchange (Blockworks)
BTC Outlook
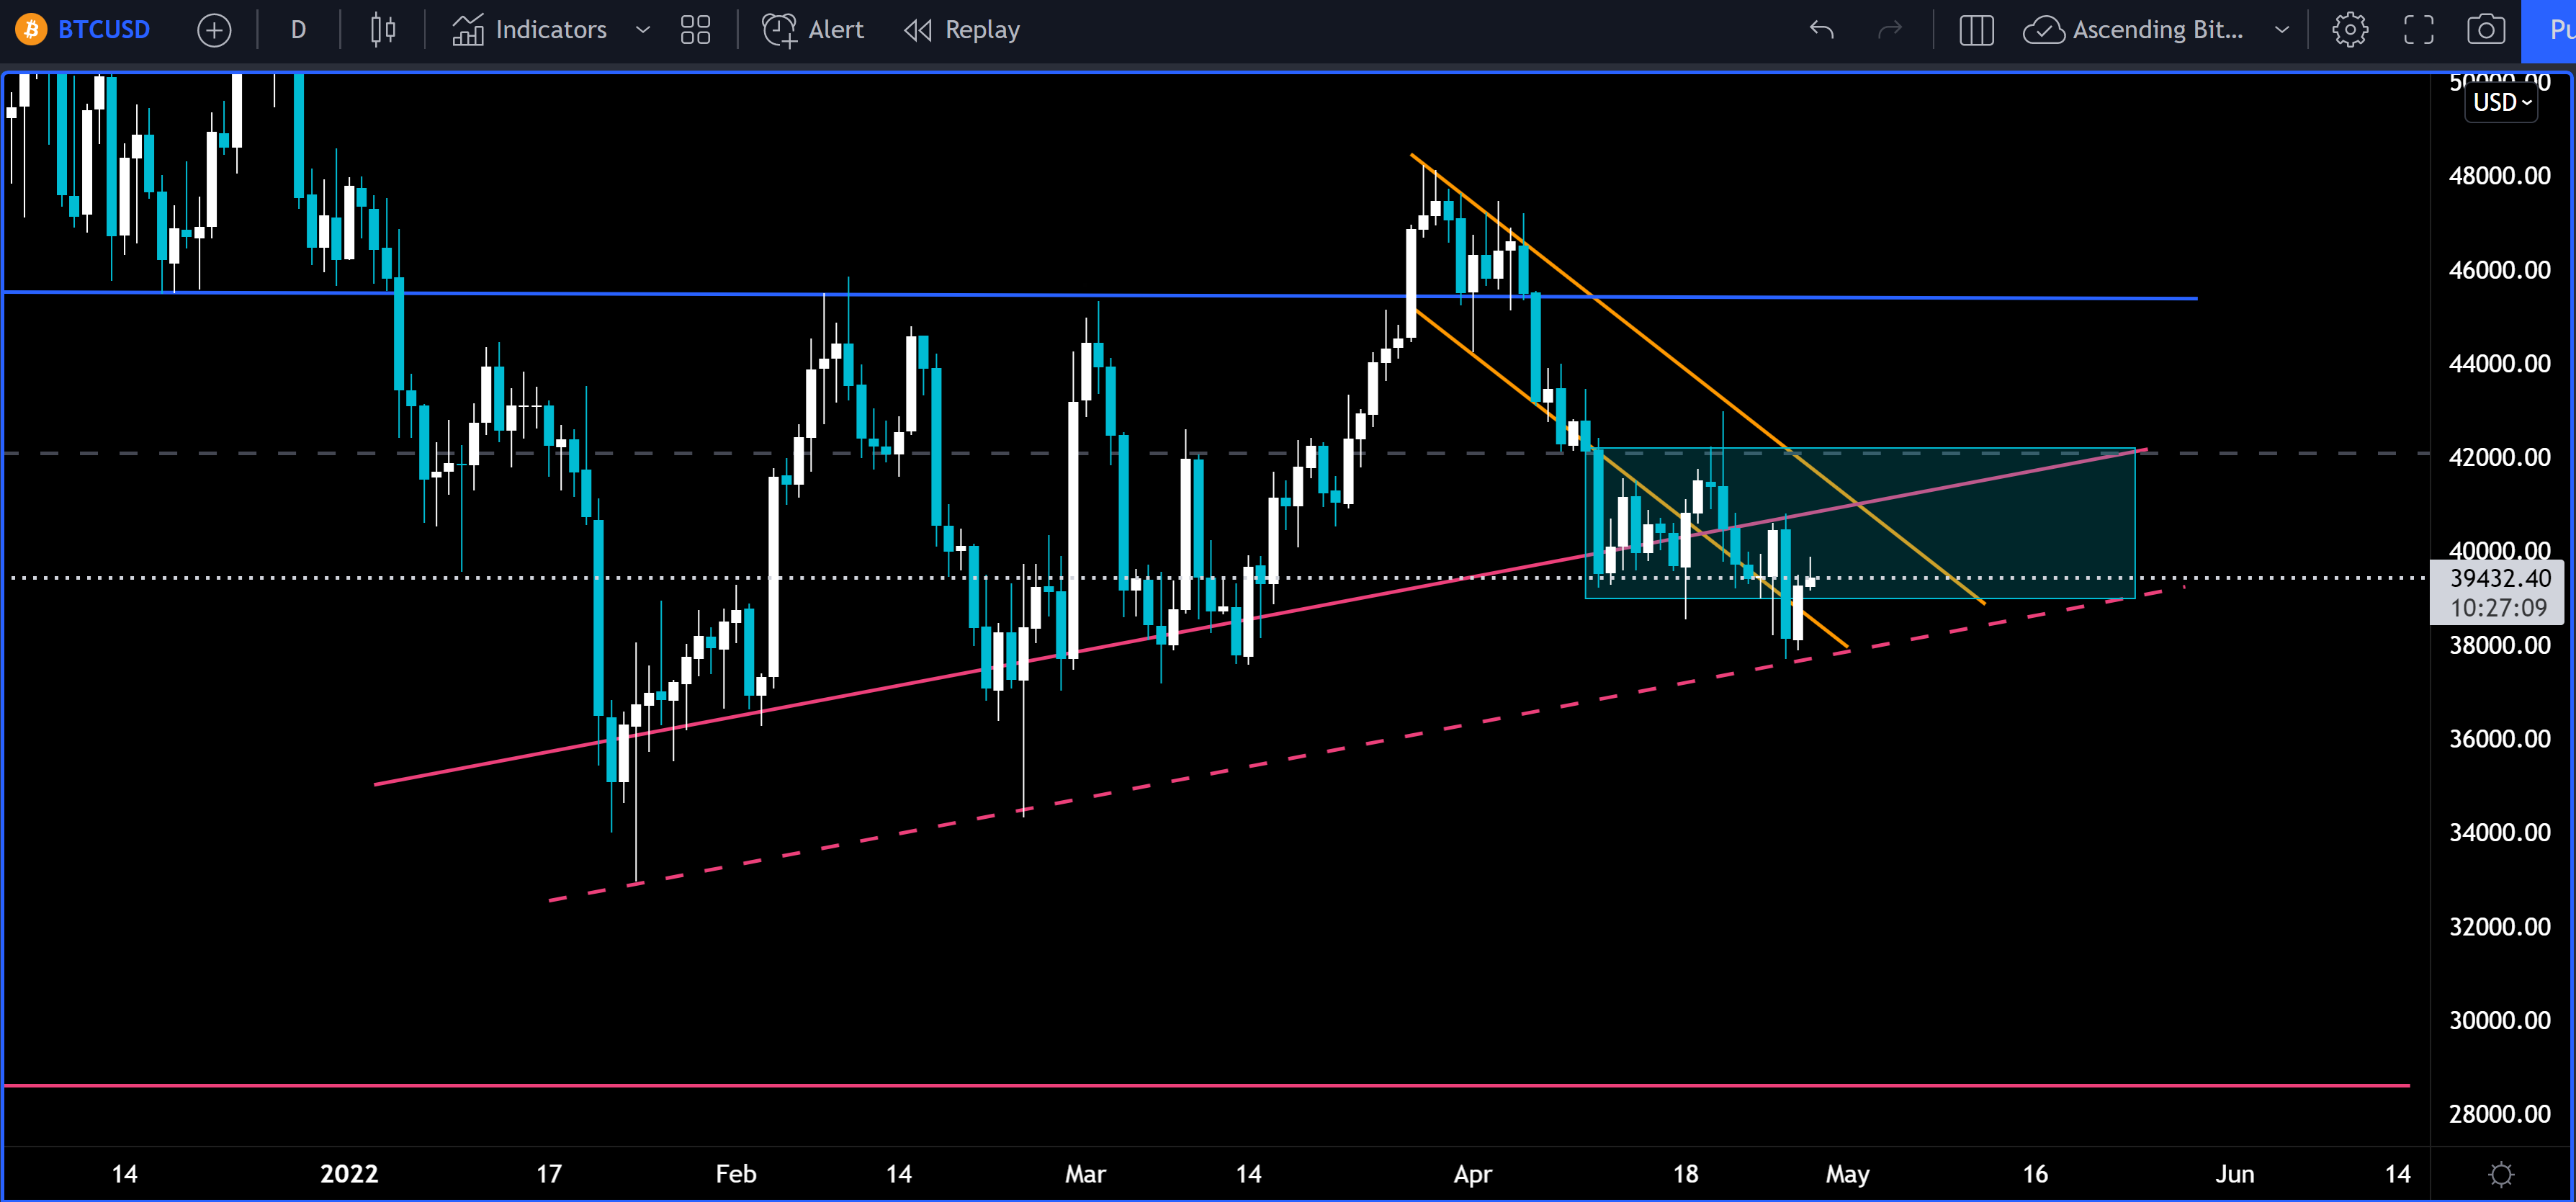
BTC’s price finally retested this pink dashed line as we have been expecting. After a quick retest and the price is back into the rectangle we drew this past Tuesday. The stock market has found some local bottom as well and now we expect BTC’s price to grind sideways. Many are still calling for sub $25k BTC and remaining on the sidelines. Someone is buying and keeping the price above this support line. The current question is will this line hold? If the price falls below this pink dashed line and does not quickly get bought up this would be a signal for the bears to come back in for a push down to $30k. It is very likely that this bearish scenario plays out if the stock market continues to sell off over the summer.
For now we are expecting sideways or bearish trading through the summer unless sentiment in the stock market changes.
Possible Course of Action
Long here expecting a retest of the top side of this rectangle
Do nothing and wait for further consolidation
The Bulls’ Defense:
Higher lowers are a sign of price support
The Bears’ Prosecution:
Global macro uncertainty

ETH Outlook
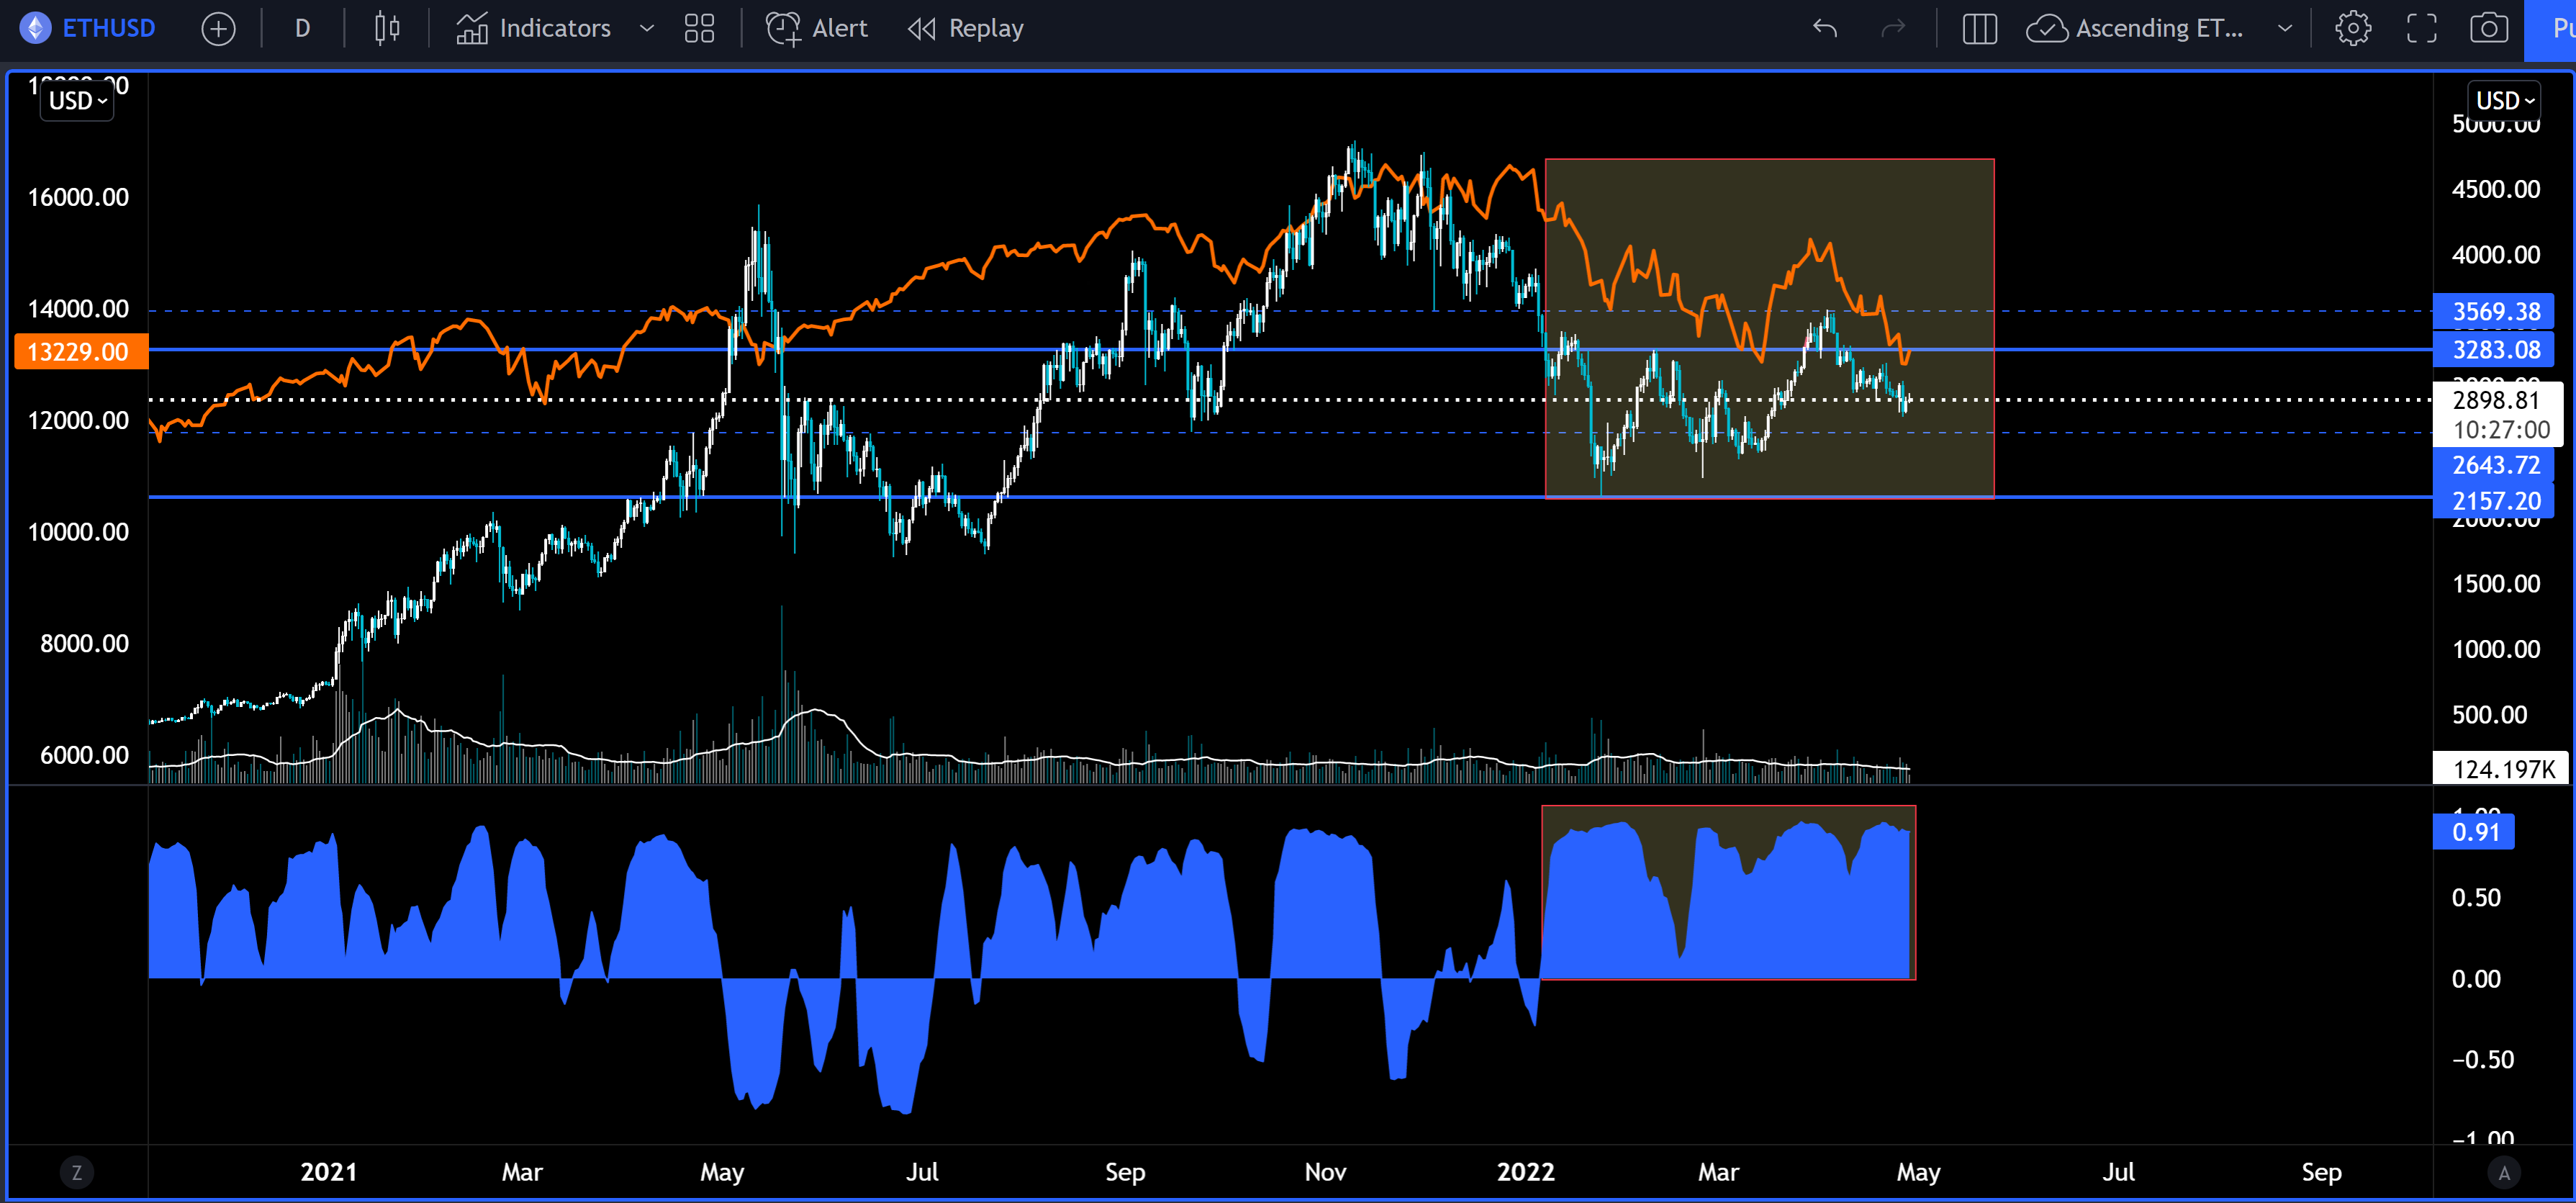
On the bottom in blue is the correlation coefficient between ETH and NQ (Nasdaq 100). You can see that on short time frames ETH goes through periods of being highly correlated with NQ. The current period has sustained a high correlation and currently is at 0.91 which can be seen on the chart with NQ (in orange) moving in lock step with ETH’s price.
It’s hard to see any pattern in what causes this correlation to break, and when it does break it doesn’t always mean that ETH’s price will go up while NQ goes down just that they stop moving in lockstep. It is important to note how high the correlation is at the current moment. It shows that investors are taking a broader view in their decision making and are not zoomed in trying to distinguish difference. Expect the rest of crypto to follow. Yes, there will be some projects that stand out in this macro moment, but most crypto price correlation is joining ETH in following tech stocks.
Possible Course of Action
Caution here as ETH is highly correlated with the tech stock sell off
Wait for further consolidation and confirmation of a higher low
The Bulls’ Defense:
EIP-1559 has burned $6,246,738,586 (2,172,446 ETH) so far. Supply constraints should continue to have a positive impact on price.
The Bears’ Prosecution:
Global macro uncertainty
Please don’t forget to like (heart button at bottom) and share this post!
Enjoying the content and want more? Get Premium Podcasts, deep videos into trading and defi, premium articles, and daily cheat sheets.
1 hour till US markets close and BTC trading above $40k