Don’t miss last weeks podcast. Hal, Boomer and Wasabi discuss the ongoing conflict in the Ukraine. Hal nails the Bitcoin price action.
CHEAT SHEET

What We Are Watching
We further breakdown our case for these cryptos here : What We Are Watching
Are you buying these tokens? Did you read our guide on how to buy them on Sushiswap and Uniswap? Got questions? Leave them in the comments.
Crypto News
Founders of Fantom take a step back (Twitter)
Bain Capital Ventures Launches $560 Million Crypto Fund (Bloomberg)
Polychain, Pantera Lead $10M Investment in Metaverse Fashion House (Decrypt)
Coinbase Blocks 25,000 Accounts Linked to Russia To ‘Support’ Sanctions (Blockworks)
Immutable Notches $2.5B Valuation After $200M Series C Financing Round (Blockworks)
World of Women Teams Up With The Sandbox for $25M Inclusivity Push (CoinDesk)
Whale Holdings in Cardano's ADA Token Hit Record High (CoinDesk)
Crypto funds register largest weekly inflows since December (CoinTelegraph)
There have been more outflows than inflows to most exchanges except Binance, FTX, Bittrex and Bitfinex since last July (CoinTelegraph)
BTC Outlook
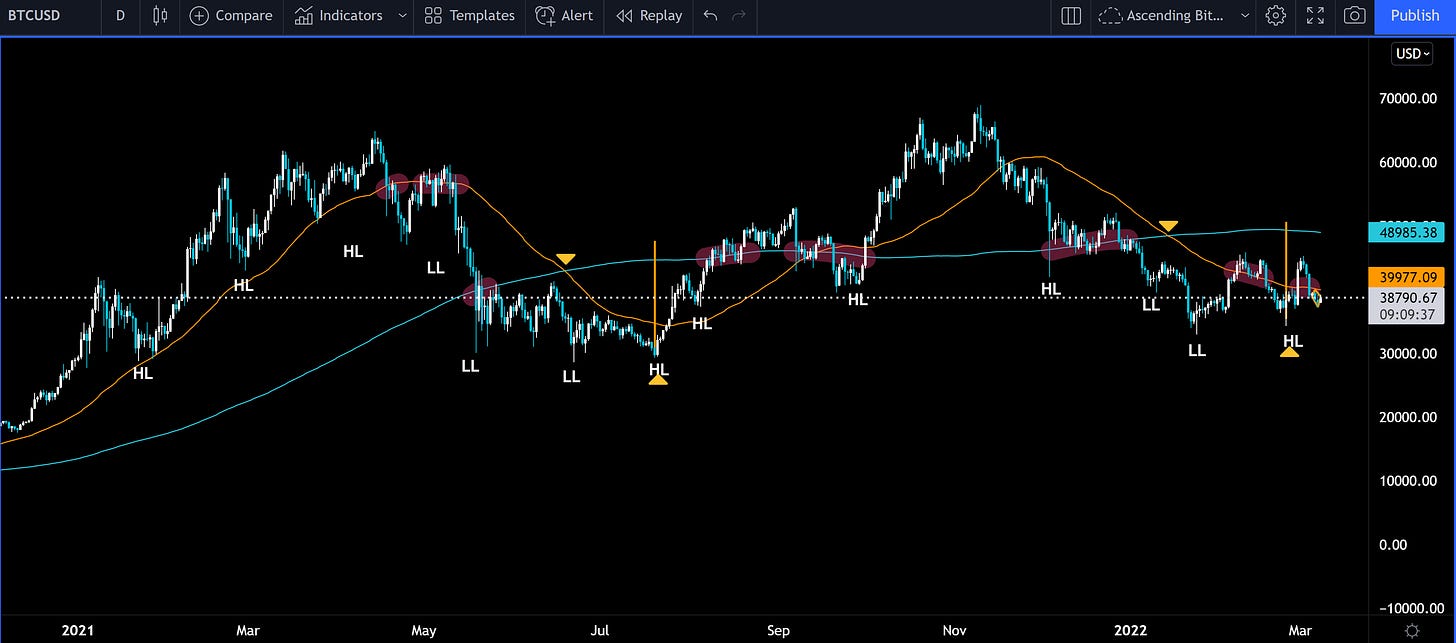
In the chart above you can see the 200-day moving average (teal line) and the 50-day MA (orange line). On June 18, 2021 and Jan 13, 2022 Bitcoin experienced a death cross. This means the 50-day MA crossed downward through the 200-day MA. This generally signals bearish price action, but it does not tell you the length or magnitude of the move. As you can see above, in 2021 the local low of BTC’s price was just a few days after the death cross (June 18 2021) but on September 13th 2021 when the opposite happened (a golden cross) it was two months before the final price top was in.
The pattern I want to bring to your attention is that once the price itself ultimately fell through the 50-day MA at the peak in April 2020 and the curve of the 50-day flattened the price then started making a series of lower lows. It was during this progressive cascade of lower lows that the death cross happened. However, similar to how a top began to form after a lower high was made and the price fell through the 50-day MA, the bottom was formed after a higher low was made.
None of this is to say that in the current moment $33k was the local bottom, but the evidence is piling up. The curvature of the 50-day MA is starting to flatten and we have now seen Bitcoin make a higher low and cross the 50-day MA twice. Anything can happen and the 50-day can continue to be rejected and a new low could be put in. However, the price rising above the 50 day and holding it as support would be a sign for many to start buying again.
Possible Course of Action (advice from last week still holds)
Short now, potential double top from $45k rejection
Look to short near $47k-$50k
Buy dips with small size
The Bulls’ Defense:
Higher Lower is a show of support
The Bears’ Prosecution:
Failure to break February highs created a double top
ETH Outlook
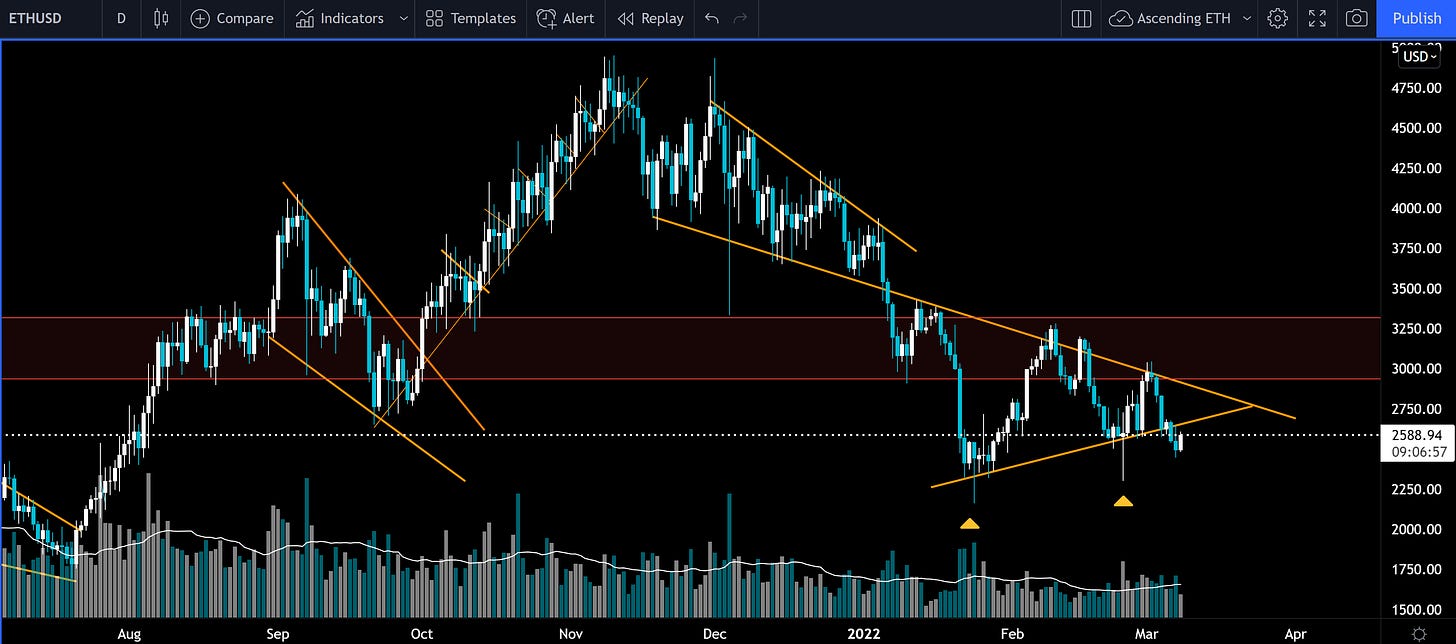
ETH’s price fell with BTC last week falling out of the bottom of this symmetric triangle. I have seen a few other chartists start to talk about this triangle on Crypto Twitter. I don’t have a strong opinion about the direction this will go. Watch the cheat sheet. The weekly support is at $2278, which would be a clear break down from this pattern. However, the price is currently above the daily support and the resistance at $2711 is in confluence with the fibonacci retracement level at the bottom side of the red box in the chart above. I’d expect the price to retest the bottom side of the triangle at a minimum.
Possible Course of Action
Cautious dip buying
Fade rallies with small shorts
The Bulls’ Defense:
EIP-1559 has burned $5,035,026,234 (1,959,581 ETH) so far. Supply constraints should continue to have a positive impact on price.
Symmetric triangle
The Bears’ Prosecution:
Symmetric triangle
Please don’t forget to like (heart button at bottom) and share this post!


