Don’t miss last weeks podcast. Hal, Boomer discuss what’s going on with oil, commodities and how it may impact Crypto.
CHEAT SHEET
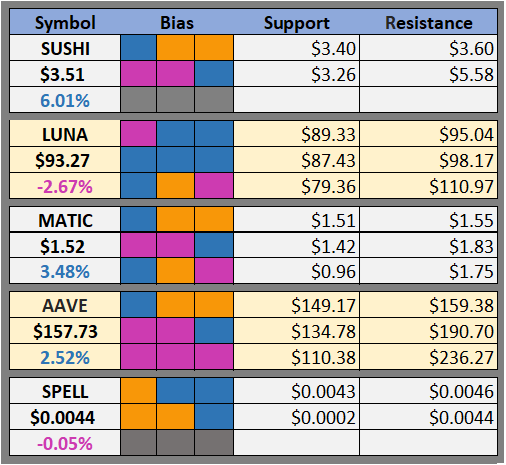
We’ve updated the cheat sheet!
In order to understand how the macro picture is developing we are now following CL (front contract of light sweet crude oil), ES (S&P 500 e-mini futures contract), NQ (Nasdaq-100 e-mini futures contract). This should help you understand the broader market conditions you are buying or selling crypto within.
We are no longer showing you the date our Bias change but instead the last 3 bias for each timeframe. For example, for the last three months Bitcoin has been bearish, this week it is bullish and the last 2 weeks were neutral for the weekly. Oil closed last week bearish but flipped bullish on the daily on Sunday and remains bullish.
Altcoins We Are Watching
Crypto News
Risk Labs created an ERC20 token calibrated to plant trees for retweeting this Twitter thread (Twitter)
Bitcoin Jumps as Do Kwon Buys $125 Million (Trustnodes)
Crypto Exchange Coincheck to List on Nasdaq via $1.25B Merger (CoinDesk)
Draper University Partners With VeChain to Train Web 3 Founders (CoinDesk)
Lemonade partners with blockchain bigwigs to combat climate change (CoinTelegraph)
DeFiance Capital founder loses $1.6M in hot wallet hack (CoinTelegraph)
NeoNexus founder pulls the plug on popular metaverse NFT project (CoinTelegraph)
Universal Music’s Web3 Label Acquires Bored Ape NFT for $360,000 (Blockworks)
FTX Launches Crypto Exchange Services in Australia (Blockworks)
Bored Ape NFT DJ Duo Goes Hollywood With WME Talent Agency (Decrypt)
Goldman Sachs Makes Over-The-Counter Bitcoin Trade—First By Major Wall Street Bank (Decrypt)
BTC Outlook
This morning we’ve drawn the current risk ranges from the cheat sheet. The daily support and resistance are drawn in pink, the weekly in orange, and the monthly in blue.
The cheat sheet is showing a neutral bias for the Bitcoin daily price. This means that we expect BTC to trade within the pink lines for the next day or so with not strong bias towards the upper or lower bound.
However, yesterday the bias on the weekly timeframe flipped from neutral to bullish. This means that we expect BTC to trade within the orange lines this week with a bias towards the upper line, i.e. over the course of the week we’d expect on average that BTC would trade in the upper half of this range rather than the lower half.
Finally, you can see that for the past 3 months we’ve had a bearish bias on the monthly timeframe, and looking at the chart Bitcoin has continued to trade in the bottom half of our risk range over the last 3 months.
From this you can see the path BTC will need to take to make it to $52k, to trade sideways, or to retrace and fall back below $40k. The weekly timeframe is now bias’d to the top of the range. Trading in this region would lead the price toward the upper risk ranges of the monthly timeframe. This means if the weekly resistance is not broken, we then must consider further consolidation and keep a watch on the daily for where we go next.
We publish the cheat sheet 365 days a year so you can follow this story and optimize your market timing. If you simply sold in December when the monthly flipped bearish and DCA’d in each time the weekly flipped bullish since then you would have: Sold above $50k and bought back one buy at $38k and another at $40k. Not a bad trade.
It’s important to get the Cheat Sheet daily so you can see when bias flip and when the price enters new risk ranges. During times of high volatility this can happen daily.
ETH Outlook
This is the line the entire ETH market should be watching if they aren’t already. Bitcoin is rallying and ETH is not. That is, it hasn’t been, or – it wasn’t. In the last week ETH broke out of this long downtrend versus BTC ever since December 2021. The price is supposedly rising with news that ETH is going to go through another upgrade in June expecting to greatly reduce its issuance rate. However, with Terra purchasing BTC last night ETH has appeared to stall out again. We will be watching this pair closely to see if ETH will give the relevant outperformance in the short-term everyone is expecting or not. We expect there to be more volatility here. Breaking a downtrend like this doesn’t guarantee ETH/BTC will continue to rise.
Possible Course of Action
Long here watching BTC and ETH/BTC pair closely
Short feels dangerous here
Do nothing and wait for confirmation (holding support on this downtrend line)
The Bulls’ Defense:
EIP-1559 has burned $6,015,417,009 (2,004,696 ETH) so far. Supply constraints should continue to have a positive impact on price.
ETH/BTC potential breakout of downtrend
The Bears’ Prosecution:
Downtrend since Dec 7 2021 could be retested
BTC may outperform in the short-term
Please don’t forget to like (heart button at bottom) and share this post!


