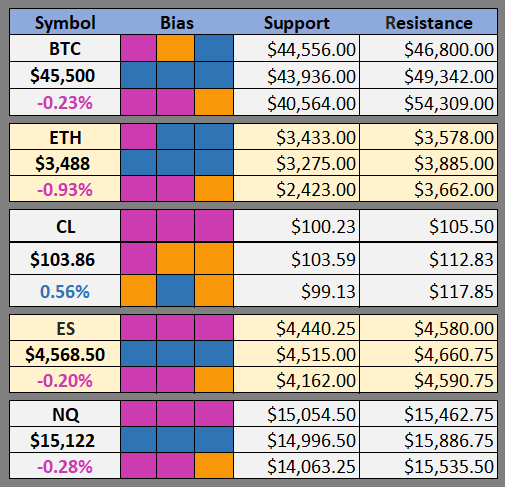
Want the Cheat Sheet delivered to your inbox daily, year round?
CHEAT SHEET

Altcoins We Are Watching

Crypto News
Dogecoin Spikes 10% After News of Musk's $3B Stake in Twitter (CoinDesk)
Terra Wallet Leap Raises $3.2M in Private Token Sale (CoinDesk)
MicroStrategy Buys $190.5M Worth of Bitcoin (CoinDesk)
Intel Unveils Latest ‘Energy Efficient’ ASIC Mining Chip (Blockworks)
PwC: More Than 80% of Central Banks Are Considering Launching a CBDC (Blockworks)
Singapore Crypto Firms Operating Abroad Must Now Be Licensed Under New Law (Blockworks)
Luxury Brand Off-White Accepts Crypto Payments Across Flagship Stores (Blockworks)
‘Decentralized Finance and Blockchain Are Real’: JPMorgan CEO Jamie Dimon (Decrypt)
Ledger launches NFT-focused hardware wallet Nano S Plus (CoinTelegraph)
BTC Outlook
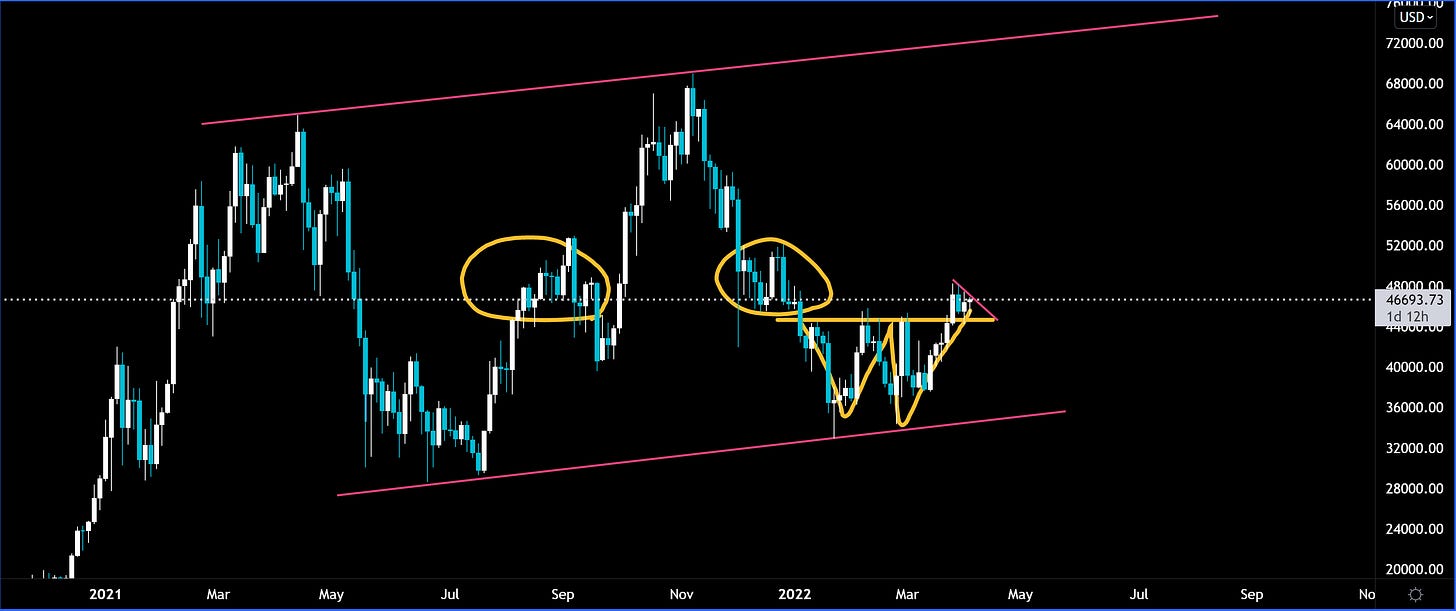
It’s no surprise BTC stalled out in the same place as last September and December. It does look like BTC has formed a W bottom that is the size of Q1. In the last week the price has consolidated and retested the neckline of this W pattern. Confirmation traders will pile in if BTC breaks out of this pennant as many would expect an impulse move up to $54-$57k.
This one is probably as easy as buying a breakout and if you are already long a stop loss around $42k should preserve your profits without getting shaken out by any fake out wicks. It does seem likely that the neckline will be retested at least one more time, which is at $44500.
Keep a close eye on the price because the Miami Bitcoin Conference is starting this week and historically these conferences have been correlated with bearish price action. Who knows though, last year the conference started when everyone was raging bullish and this year it’s starting when everyone is depressingly bearish.
Possible Course of Action
Do nothing wait for breakout of current consolidation
Pick up longs on the bottom side of consolidation (above $42k)
The Bulls’ Defense:
Potential Bull Flag
The Bears’ Prosecution:
A rejection of this W bottom could lead to weeks or months of more downward price action
ETH Outlook
Since ETH broke out of this symmetric triangle on March 18th it has been going up and to the right. For nearly 3 weeks ETH’s price has been trading upward inside of this parallel channel. Technically this is bearish, as one would expect the price to eventually lose momentum and fall out of the bottom of this channel. However, this channel could continue on for who knows how long.
If you’ve been long since March taking profits on the top of this channel and setting a stop loss under the bottom is probably prudent. If you aren’t long, it’s probably better to wait for the price to break out of the bottom side of the channel and consider buying then. Shorting breakouts of the top side of the channel has only worked if you are trading low time frames and day trading.
Possible Course of Action
Long the bottom side of this channel or wait for a breakdown
Sell or Short the top side of this channel
The Bulls’ Defense:
EIP-1559 has burned $$7,303,966,526 (2,070,567 ETH) so far. Supply constraints should continue to have a positive impact on price.
Strong Up And To The Right price momentum
The Bears’ Prosecution:
Rising channel will breakdown eventually
Please don’t forget to like (heart button at bottom) and share this post!


