Want more from Foot Guns? Subscribe to become a premium member and get more podcasts, more updates and access to our private channels in discord were we actively discuss trade ideas.
Cheat Sheet -
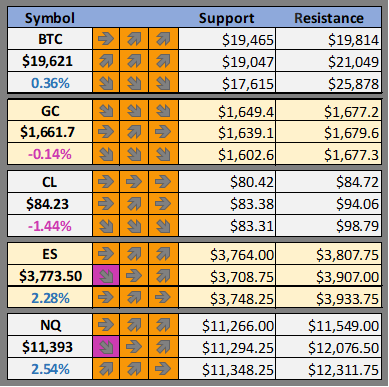
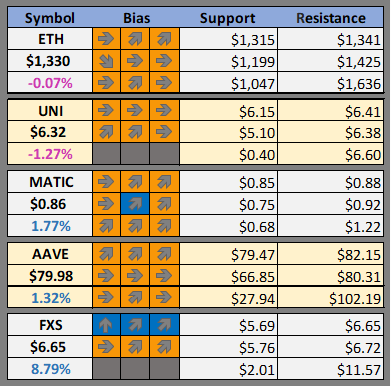
Support and resistance levels and our daily, weekly and monthly bias on BTC, GOLD, OIL, ES, and NQ as well as our favorite altcoins
New here? Learn how to read the cheat sheet.
What We Are Watching
We further breakdown our case for these cryptos here : What We Are Watching
Crypto News
Do Kwon says charges 'politically motivated,' refuses to reveal location (The Block)
Ozzy Osbourne, Soulja Boy to join Decentraland Metaverse Music Festival (The Block)
FTX, a16z-Backed Aptos Blockchain Off to a Rocky Start (CoinDesk)
SEC, CFTC Probing Bankrupt Crypto Hedge Fund Three Arrows Capital (CoinDesk)
Ethereum solo validators that censor blocks should ‘be tolerated’ (CoinTelegraph)
Walmart CTO Weighs in on the Role of Crypto Disruption (Blockworks)
Riot Blockchain CEO: Firm Is One of Mining Space’s ‘Best-positioned Acquirers’ (Blockworks)
Bored Ape Yacht Club Founders Talk SEC Investigation and Getting 'Doxxed' (Decrypt)

BTC Outlook
First of all, this is a BTC weekly timeframe on a log scale. This way it is easier to demonstrate a point, but its not recommended to spend too much time looking at the log scale. However, because BTC had such a huge price swing over the last two years the log scale makes it easier to view the macro picture of the price. What we are focused on this morning is the 20 week moving average (blue line) and the RSI below (purple line).
As you can see above BTC has been trading under the 20 week moving average since April 2022. In fact, now that time has played out, it appears BTC has been in a down trend since the first time it crossed the 20 week moving average to the down side in May 2021. When BTC crossed the 20 week moving average moving up in the summer of 2021 it then resulted in a rally to the end of the year and it would not cross the moving average again until December 2021. The point is, this 20 week moving average is popular with Bitcoin investors and traders and looked at by many. This is why when the macro picture for BTC is bullish the price trades above the 20 week MA and when it is bearish it is below it.
The other point to take away is that when the price is near the 20 week MA the RSI (purple line) is at or near lvl 50. You can see this for yourself on the vertical yellow lines on the chart above. With the current dwindling volatility the price is moving sideways and the 20 weeks MA is moving closer and closer to the price. If you look closely at the chart you’ll notice that in the past few weeks the RSI has actually been slowly moving upward.
In the coming weeks the price will once again test the 20 week MA as resistance. If history repeats a rejection of the 20 week MA will likely result in further downside, but if the price can move above it and hold it as support expect mid-term upside that could turn into a longer rally.
Please join us in our discord where we discuss active and potential trades.
Possible Course of Action
Long if price rises above and holds 20 week MA as support
Short if price meets 20 week MA as resistance
The Bulls’ Defense:
Momentum of macro downtrend lost
The Bears’ Prosecution:
Price still under 20 week MA
A Closer Look
This section will be focused on taking a closer look on what Hal thinks is important to watch in the coming week.
Today we’ll look at Ethereum’s price action in USD and BTC.
Keep reading with a 7-day free trial
Subscribe to Foot Guns to keep reading this post and get 7 days of free access to the full post archives.


